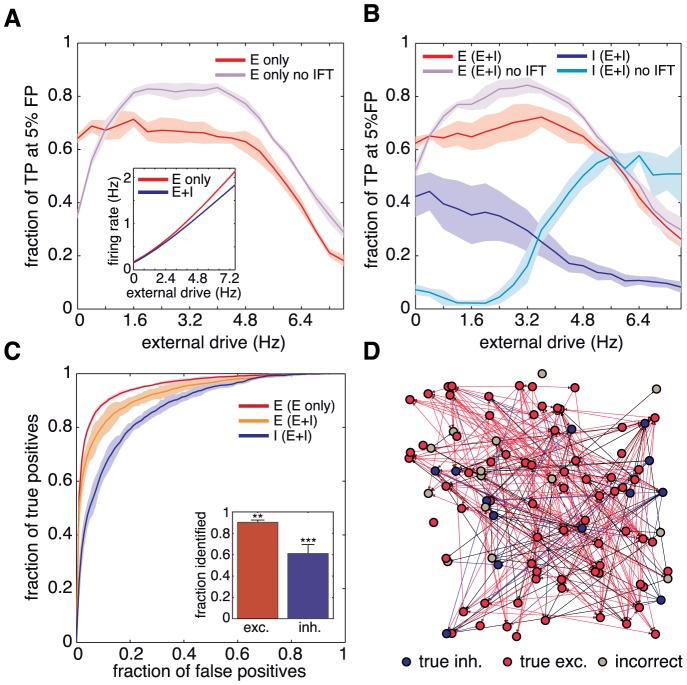
Figure 4. Reconstruction improvement through external stimulation.
A and B, fraction of true positives from the reconstructions at the 5% false positive mark for the studied networks. “E–only” networks are shown in A; “E+I” networks in B. Inset: dependence of the spontaneous firing rate on the applied external drive, emulated here by increasing the rate of the background drive to the culture in silico. All the excitatory reconstructions reach a stable plateau in the reconstruction after removal of the instantaneous feedback term (IFT) correction (see Methods). The inhibitory reconstruction is accurate only for higher values of the external drive. C ROC curves extracted from A and B with an external stimulation of 4 Hz. Inset: fraction of excitatory and inhibitory neurons correctly identified from these reconstructions. Identification was statistically significant compared to random guessing. For excitatory neurons,  (**); for inhibitory neurons,
  (***). D Example of an actual reconstruction after identification of neuronal type. Identified excitatory neurons are shown in red and inhibitory ones in blue. Incorrectly identified neurons are shown in grey. Correctly identified excitatory and inhibitory links are shown in red and blue, respectively, and wrongly identified links are shown in black. For clarity in the representation of the links, a threshold value lower than the optimal has been applied.

