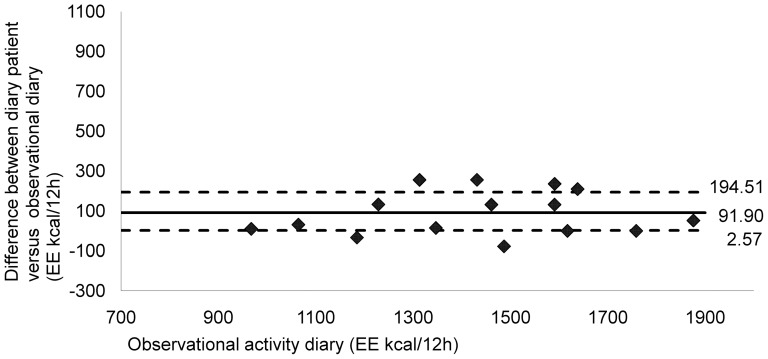
Figure 3. Comparing energy expenditure in 16 stroke patients: observational diary versus patient diary.
Energy expenditure (kcal/12 h) of observer activity diary was compared with diary of stroke patients. Broken horizontal lines represent percentiles 25 and 75 value, bold solid lines represent the median value of difference. Data analysis showed good agreement between both diaries (Median = 91.90; P25 = 2.57; P75 = 194.51). Most data are clustered around the zero point.

