Figure 4.

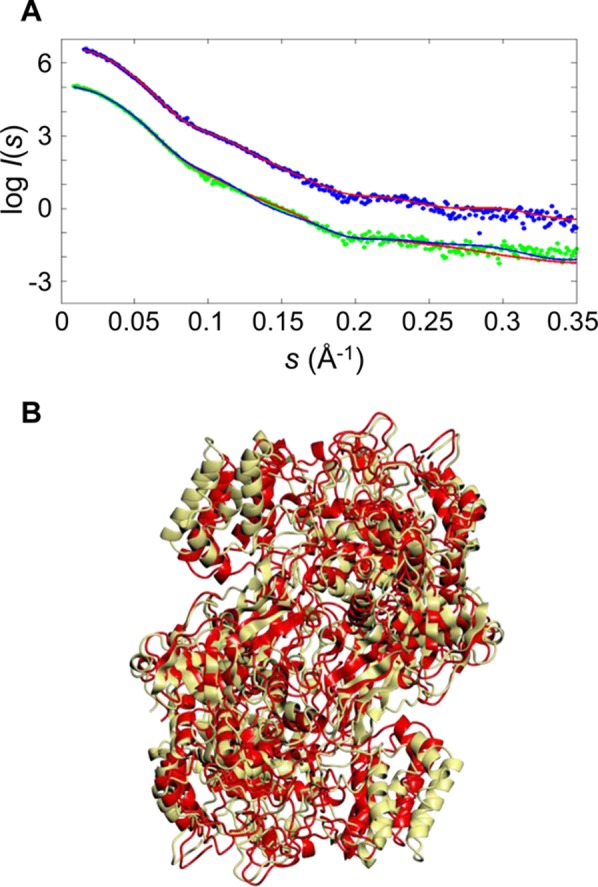
SAXS analysis of GlgE proteins. The upper curves (A) show the SAXS data and fit for the S. coelicolor GlgE protein (χ = 1.03; experimental data colored blue and the theoretical profile colored red on the basis of its X-ray crystal structure). The lower curves show the M. tuberculosis GlgE SAXS data and fit of the theoretical profile of the initial homology model based on the S. coelicolor GlgE crystal structure (χ = 1.34; experimental data colored green and fit colored blue) and after the GENCRY rigid body refinement giving a significantly better fit particularly in the range of 0.1–0.2 Å–1 (χ = 1.09; theoretical fit colored red), consistent with a better relative orientation of the monomers. The SAXS profiles are displaced along the logarithmic axis for the sake of clarity. The homology model of the M. tuberculosis GlgE dimer (B) based on the S. coelicolor GlgE structure before (yellow) and after (red) rigid body refinement gave a root-mean-square deviation of 6.8 Å. The overall orientation of the dimer is similar to that in Figure 1.
