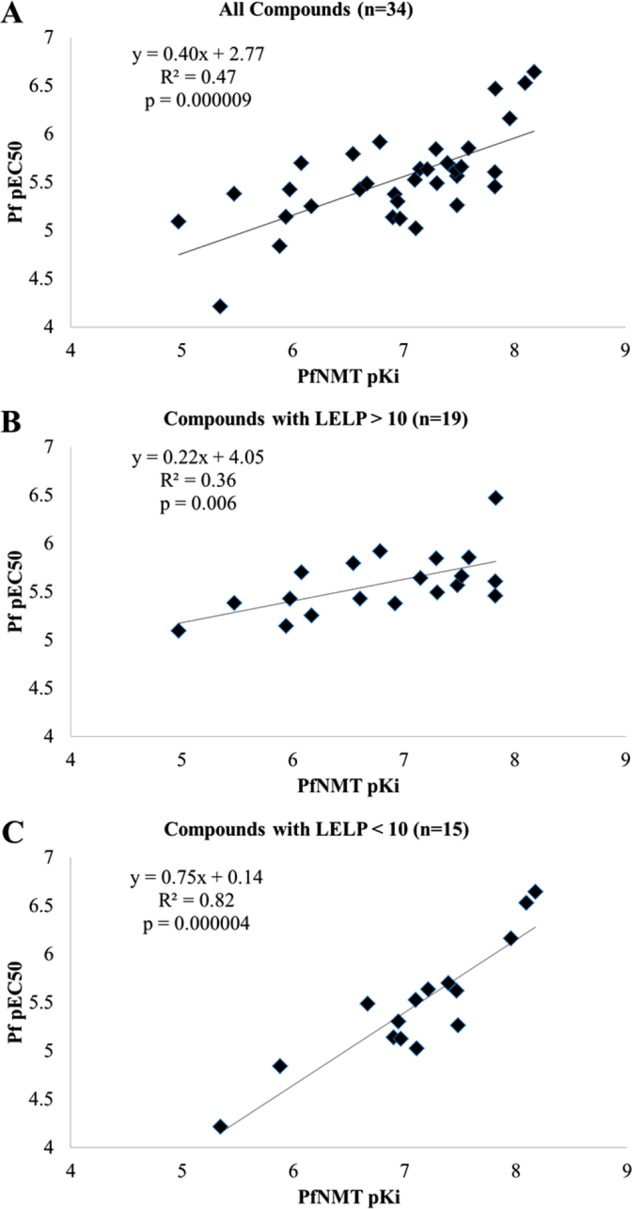
Figure 6.

(A) Plot of cellular potency vs enzyme affinity for all members of this series tested in both assays. (B) Plot of cellular potency vs enzyme affinity for all compounds with a LELP of >10. (C) Plot of cellular potency vs enzyme affinity for all compounds with a LELP of <10.
