Figure 1.
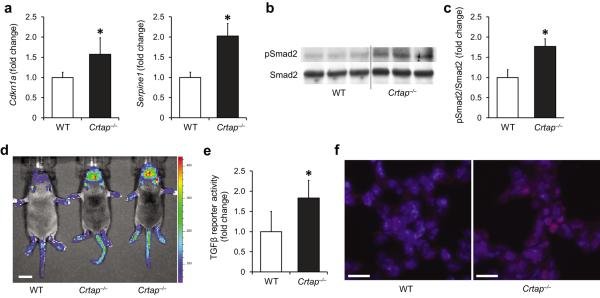
Excessive TGFβ signaling in Crtap−/− mice. (a) Quantitative RT-PCR of TGFβ target genes Cdkn1a and Serpine1 in calvarial bone of P3 WT and Crtap−/− mice. Results are shown as fold change of the mean of WT group±SD; n=5 per group. (b) Western blot analysis of P3 calvarial protein extracts showing amounts of activated Smad2 (pSmad2) relative to total Smad2 protein in Crtap−/− versus WT mice; n=3 per group. (c) Quantification of the Western blot shown in b. Results are shown as fold change of the mean of WT group±SD. (d) Bioluminescence in regions that overlap with skeletal structures in Crtap−/− compared with WT mice that were intercrossed to TGFβ-reporter mice (SBE-Luc mice). Representative image of 3 litters at P10 is shown (scale bar=1cm). (e) TGFβ activity in conditioned medium from WT and Crtap−/− bone marrow stromal cells cultured under osteogenic conditions. Results are shown as fold change of the mean of WT group±SD, n=6 per group. (f) Immunostaining of lungs (P10) for pSmad2 (red) in WT and Crtap−/− mice, DAPI (blue) staining of nuclei (40X magnification). Representative images of n=3 mice per group are shown (scale bar=20μm). *P<0.05 WT versus Crtap−/−.

