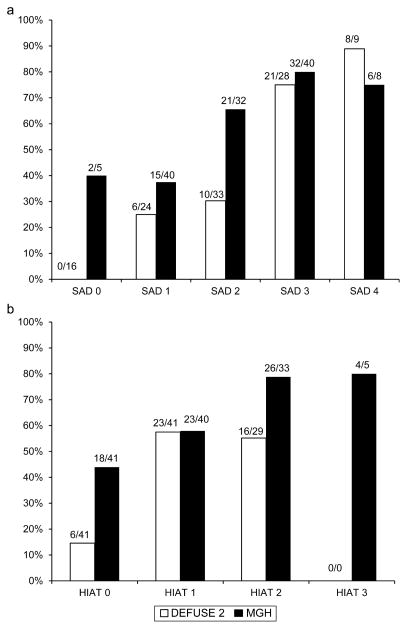
Fig. 1.
Percentage of patients with poor outcome, defined as mRS score of 4–6 at 90 days as a function of (a) SAD score and (b) HIAT score. White bars correspond to the DEFUSE 2 dataset and black bars correspond to the MGH validation dataset. The proportion of patients with poor outcome is shown above each bar. SAD Score = Stanford Age and DWI score; HIAT score, Houston IAT score.

