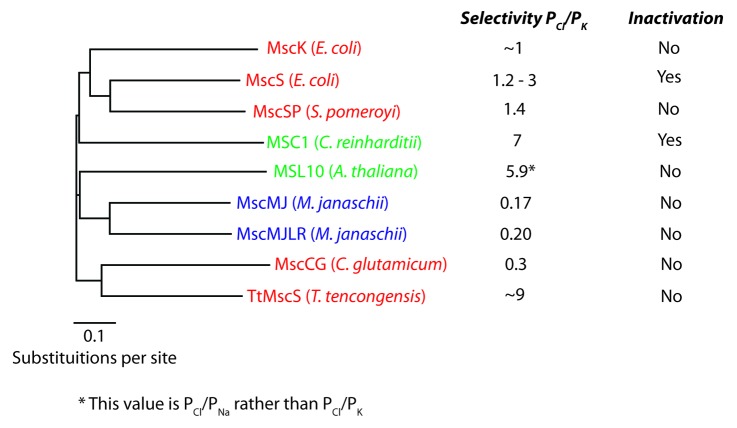
Figure 3. MscS subfamily phylogenetic tree displaying 9 electrophysiologically-characterized homologs. The reported anion-cation permeability ratios expressed as PCl/PK are illustrated along with whether these channels display inactivation. Bar represents 0.1 substitutions per site. (Green = archaea, Black = bacteria, Red = eukaryotes)

An official website of the United States government
Here's how you know
Official websites use .gov
A
.gov website belongs to an official
government organization in the United States.
Secure .gov websites use HTTPS
A lock (
) or https:// means you've safely
connected to the .gov website. Share sensitive
information only on official, secure websites.
