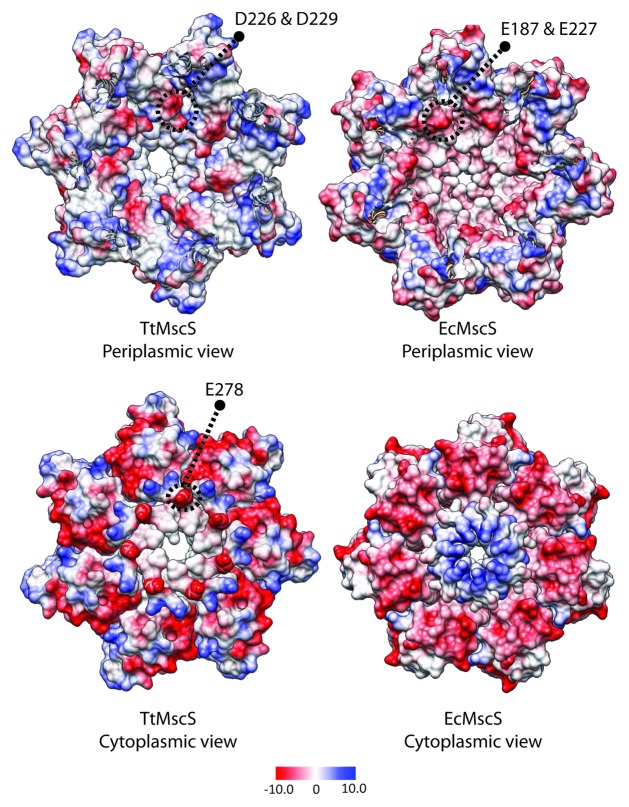
Figure 4. Comparison between EcMscS and TtMscS cytoplasmic domains. Upper panel shows a Coulombic charge distribution of a transverse section as viewed from the periplasmic side of TtMscS (PDB: 3T9N; left side) and EcMscS (PDB: 2VV5; right side). Regions of electronegativity (denoted as red) can be identified centered around D226/D229 and E187/E227, respectively. The lower panel shows the underside of the cytoplasmic domain of TtMscS (right side) EcMscS (left side) highlighting the β-barrel residue implicated in anion selectivity in TtMscS (kcal/(mol·e) at 298 K).

An official website of the United States government
Here's how you know
Official websites use .gov
A
.gov website belongs to an official
government organization in the United States.
Secure .gov websites use HTTPS
A lock (
) or https:// means you've safely
connected to the .gov website. Share sensitive
information only on official, secure websites.
