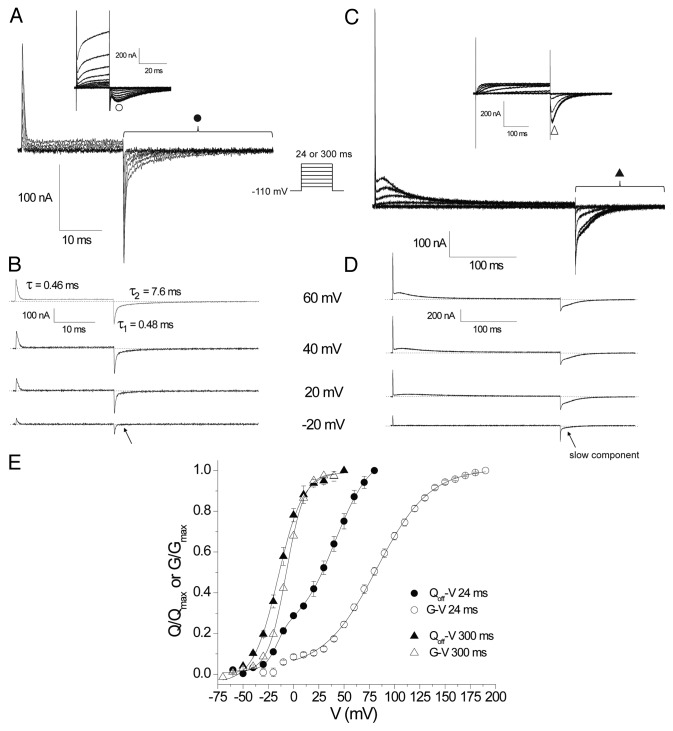
Figure 1. Comparison of WT hERG gating and ionic currents over 24 ms and 300 ms depolarizing pulses. (A) Representative traces of gating currents recorded in response to depolarizing steps of 24 ms from a HP of -110 mV. Traces from depolarizations between -60 and +60 are shown in 20 mV increments. Inset are representative traces of ionic currents recorded using the same protocol illustrating traces from depolarizations between -90 and +190 in 20 mV increments. (B) Isolated traces of gating currents demonstrate a fast IgON component of charge movement at all voltages and the emergence of a slower component of charge movement positive to 20 mV which is clear in the biexponential fit of the IgOFF currents at +60 mV. (C) Representative gating (from -60 to +60 mV) and ionic (inset, from -60 to +80 mV) current traces from a family of 300 ms depolarizing pulses. (D) Isolated gating current traces illustrating the development of a slow IgON component which develops concurrently with a slowing in the IgOFF currents. (E) Isochronal peak ionic tail current GV relationships for 24 ms (○) and 300 ms (∆) depolarizations and QOFF-V relationships from integration of IgOFF currents for 24 ms (●) and 300 ms (▲) depolarizations. Data points were fit with a single Boltzmann function of the form where y/ymax is the normalized response; either G/Gmax or Q/Qmax, V0.5 the half activation potential and k the slope factor or a double Boltzmann function where A is the amplitude of the fit component.

An official website of the United States government
Here's how you know
Official websites use .gov
A
.gov website belongs to an official
government organization in the United States.
Secure .gov websites use HTTPS
A lock (
) or https:// means you've safely
connected to the .gov website. Share sensitive
information only on official, secure websites.
