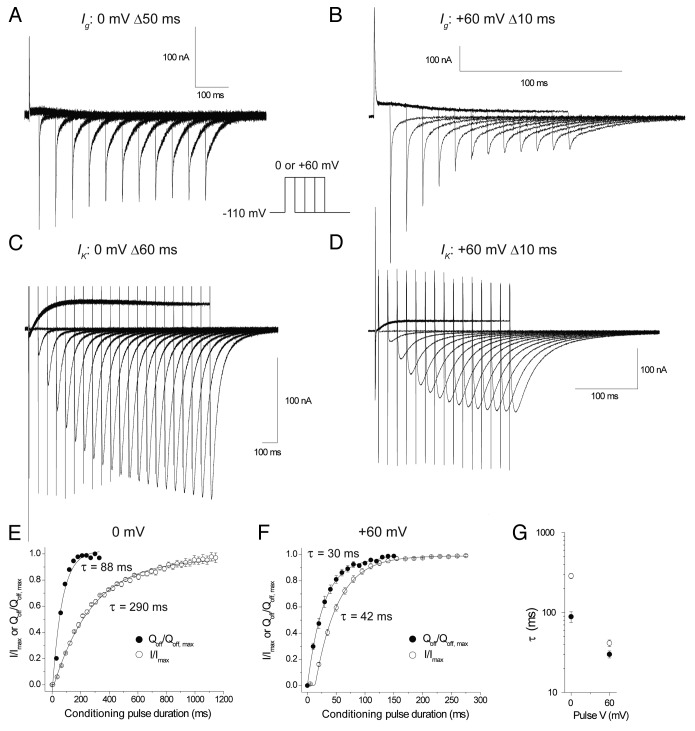
Figure 2. Kinetics of hERG charge movement and ionic activation at 0 mV and +60 mV. Representative trace of gating currents evoked by steps to (A) 0 mV extending in 50 ms increments or (B) +60 mV in 10 ms increments. (C) Representative trace of ionic currents evoked by steps to 0 mV extending in 60 ms increments or (D) +60 mV in 10 ms increments. Plot of the normalized Qoff (●) and normalized peak ionic tail currents (○) after increasing durations of a 0 mV (E) or +60 mV (F) conditioning step. Charge movement was fit with a single exponential () and ionic currents with a delayed exponential where y is the normalized response, t is the duration of the conditioning pulse, A the amplitude, τ the time constant and H the unit step function where t0 is the delay before onset of the exponential rise. (G) Time constants for gating charge movement and ionic current activation at 0 and +60 mV.

An official website of the United States government
Here's how you know
Official websites use .gov
A
.gov website belongs to an official
government organization in the United States.
Secure .gov websites use HTTPS
A lock (
) or https:// means you've safely
connected to the .gov website. Share sensitive
information only on official, secure websites.
