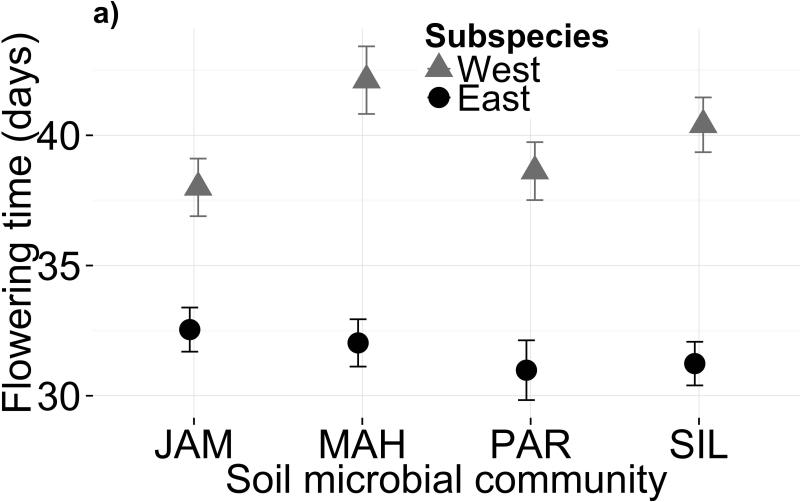
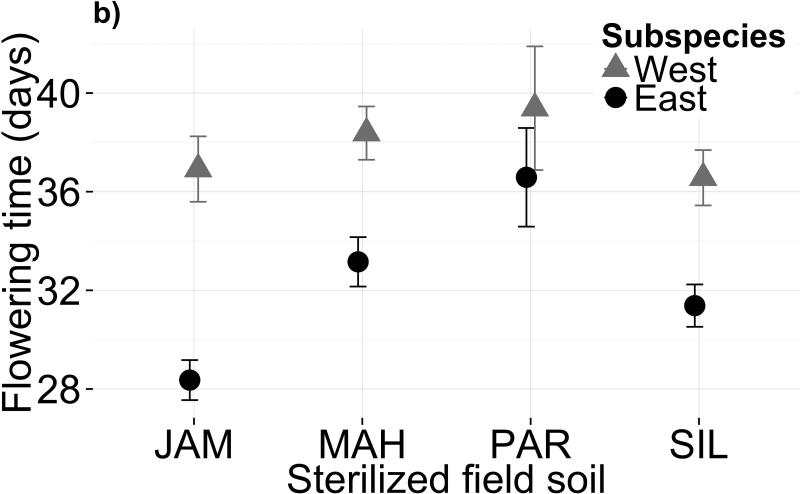
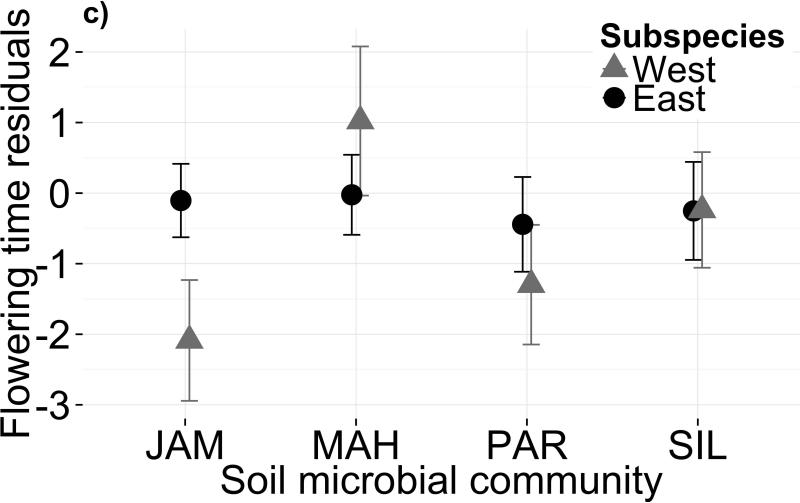
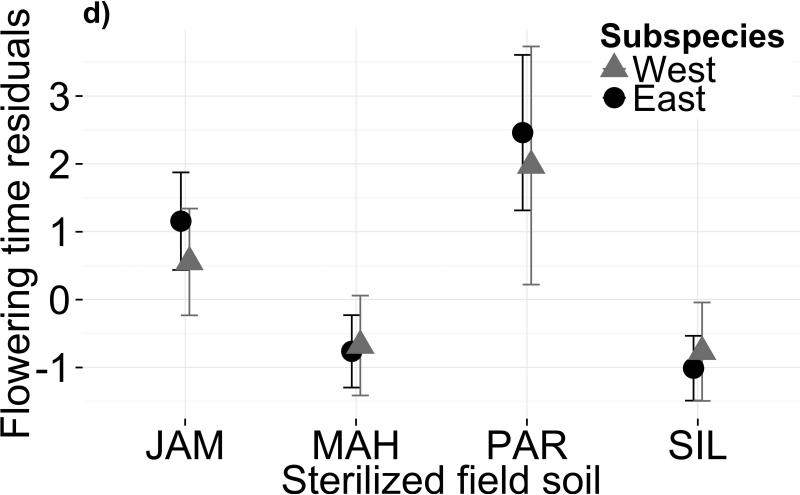
Figure 1.
Variation in both soil microbiota and soil chemistry alters flowering phenology. Mean flowering time post-vernalization (raw data, in days) is shown for each subspecies in (a) four microbial treatments and (b) four sterilized field soils. Panels (c) and (d) show mean flowering time residuals, after controlling for genetic differences and growth covariates, for each subspecies in biotic and abiotic treatments, respectively. Error bars depict one standard error from the mean. Parameter estimates and standard errors are reported in Table S3


