
Figure 3.
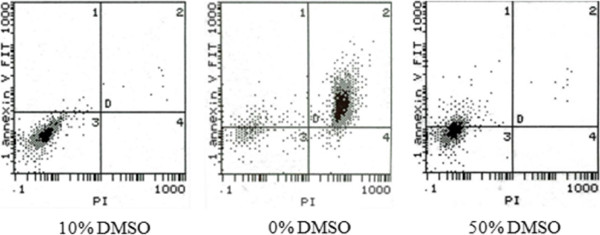
Scatter plot of double-parameter flow cytometry. Human SV40 transfected osteoblasts; dots at lower left quadrant (H3) were viable cells (FITC-/PI-); dots at upper right quadrant (H2) were non-viable cells, which were necrotic (FITC+/PI+); dots at upper left quadrant (H3) were apoptotic cells (FITC+/PI-).