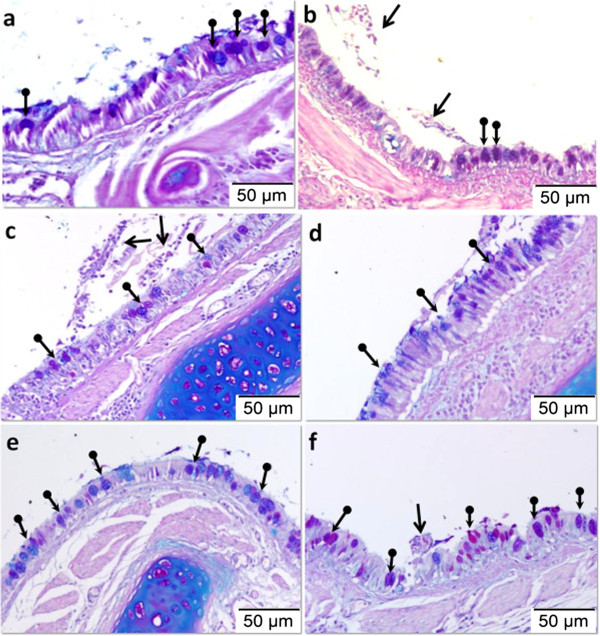
Figure 5.

Effect of aerosolised honey treatment on goblet cell hyperplasia. The panels show AB-PAS stained lung tissues from the control group (a), injury group (b), 25% honey-treated group (rescue, c; preventive, d), and 50% honey-treated group (rescue, e; preventive, f). Arrows in the figure indicate the accumulation of mucus in the airway lumen, and round-ended arrows indicate representative images of goblet cells.
