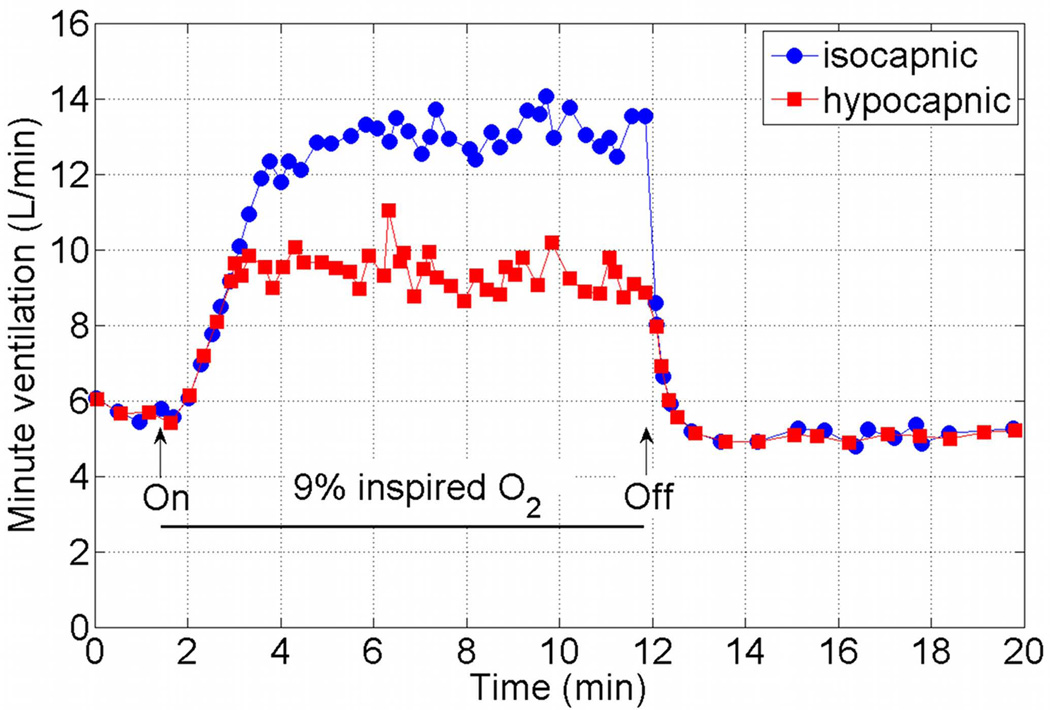
Figure 4.
Mean response of minute ventilation in 10 human subjects to 9% inspired O2. The upper curve shows the results when the alveolar CO2 concentration was controlled. The data was extracted from Figure 8 of Reynolds & Milhorn (1973)16 (figure used with permission, American Physiological Society) using the ENGAUGE software available from http://sourceforge.net15.

