Figure 3.

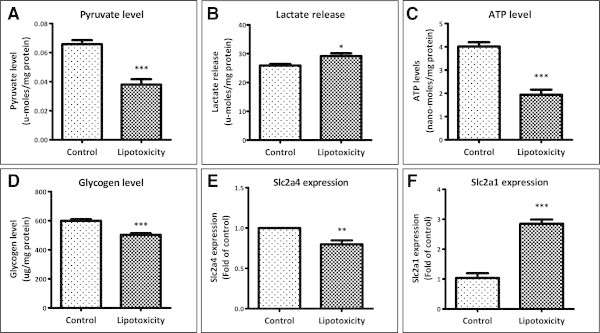
Impact of lipotoxic condition on glucose metabolism. (A) After lipotoxic treatment, myotubes were lysed and cellular pyruvate levels were measured (*** P < 0.001). (B) Lactate release from myotubes was measured in culture medium collected after lipotoxic treatment (* P < 0.05). (C) Cellular ATP levels (*** P < 0.001) and (D) glycogen storage (*** P < 0.001) were measured after lipotoxic treatment as described in Methods. After lipotoxic treatment, RNA was isolated and mRNA levels of glucose transporter Glut4/Slc2a4 (** P < 0.01; E) and Glut1/Slc2a1 (*** P < 0.001; F) were quantified using qPCR.
