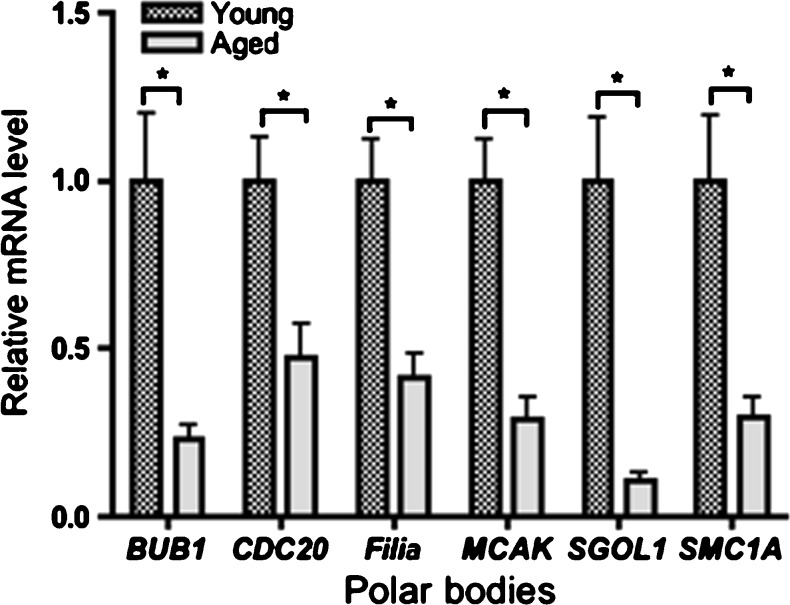
Fig. 3.
Candidate genes expression in normal PB from young and aged mice (n = 20). Results are normalized to each transcript in PB from young mice as 1 (the calibrator). PBs from aged mice had significantly lower levels of all six transcripts compared with PBs from young mice. Fold change: 2− ΔΔCt; ΔΔCt = [Ct(Target) − Ct(18s)]aged − [Ct(Target) − Ct(18s)]young. Error bars represent SD. * significance relative to young mice (P < 0.05)

