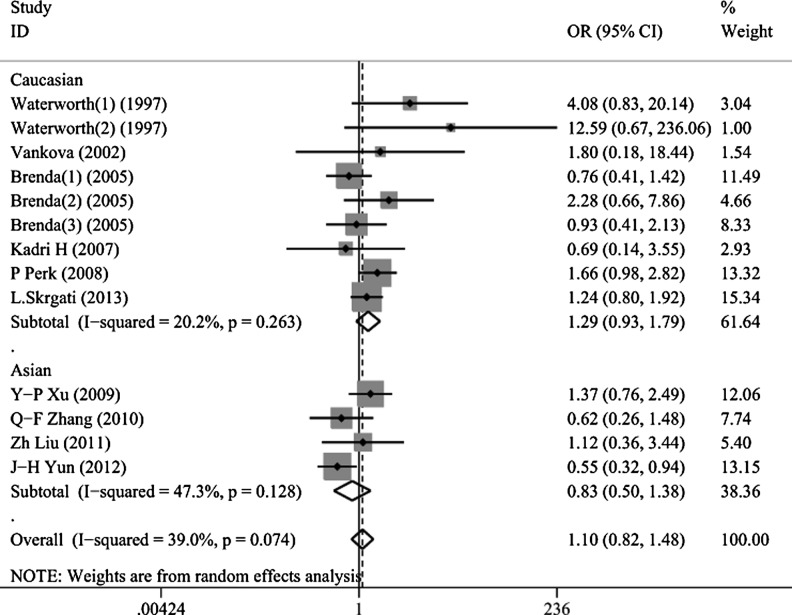
Fig. 2.
Forest plots of INS VNTR polymorphisms and PCOS risk using a random-effect model (recessive model III/III vs. I/III + I/I). The squares and horizontal lines correspond to the study-specific OR and 95 % CI. The area of the squares reflects the study-specific weight (inverse of the variance). The diamond represents the summary OR and 95 % CI

