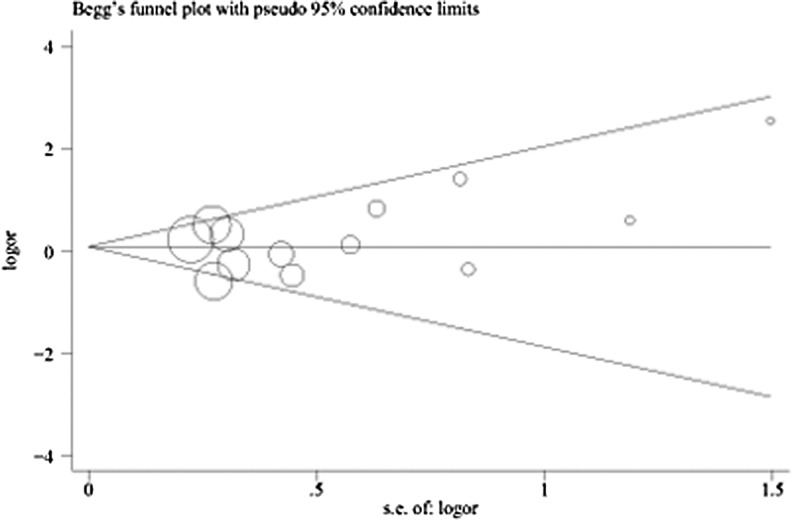
Fig. 3.
Begg’s funnel plots for publication bias in the studies of the meta-analysis on the association between INS VNTR and PCOS risk of the overall populations (recessive model III/III vs. I/III + I/I). Each point represents a separate study for the indicated association. Log [OR], natural logarithm of OR. Horizontal line means effect size

