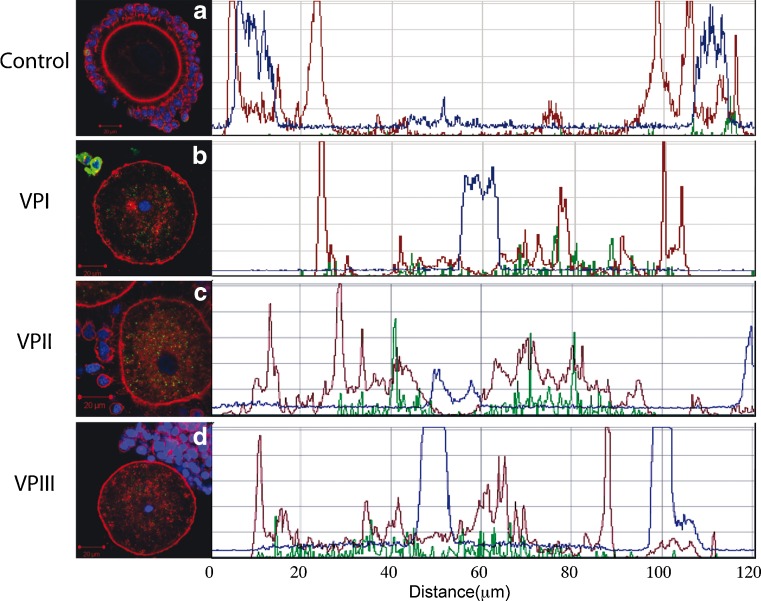
Fig. 3.
Triple fluorescence images of a single plane for f-actin (red), chromatin (blue), and MPM-2 (green) are shown for representative control (a), VP1 (b), VP2 (c), and VP3 (d) oocytes. In each case, a line was drawn across the entire oocyte that transected the chromatin and the graphs to the right depict the optical density profiles for each signal in their respective colors. NSN (a) and CCM (b–d) chromatin signals are evident in the center of the plot (b–d). MPM-2 shows no detectable signal in control and cytoplasmic signal in each of the vitrified oocytes shown here (b–d, green). The prominent f-actin signal in the cortex of control oocytes (a, red) is notably diminished in vitrified samples that also show an increase in total cytoplasmic phalloidin labeling (b–d, red)

