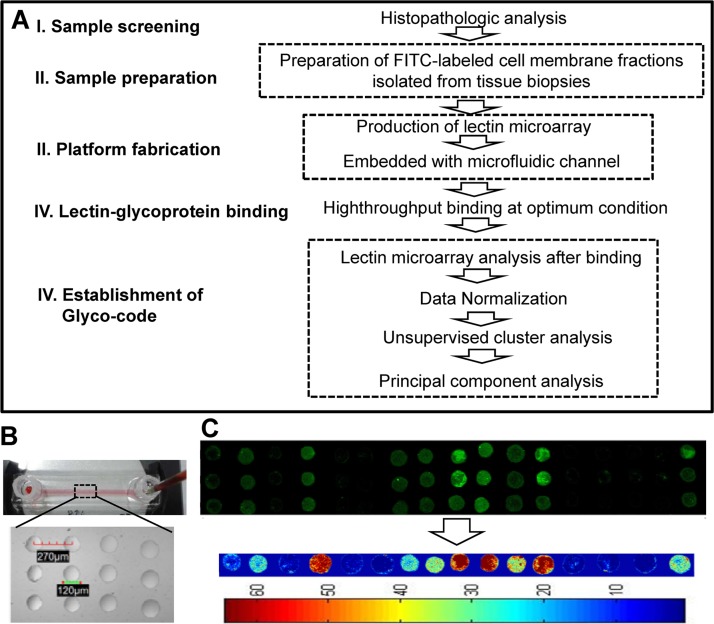
Figure 2.
(a) Strategy used to screen the glycosylation patterns and establish the glyco-code using samples of normal, chronic Type B, Type C gastritis, and gastric cancer sera and biopsies. (b) Representative microfluidic platform with fluidic setup. Inset: bright field image of lectin microarray on the ground surface of the channel. (c) Representative image of lectin microarray showing comparison of bound fraction of labeled glycoprotein across all the 17 lectins in triplicate. Matlab processed intensity contour picture of the above fluorescent image.

