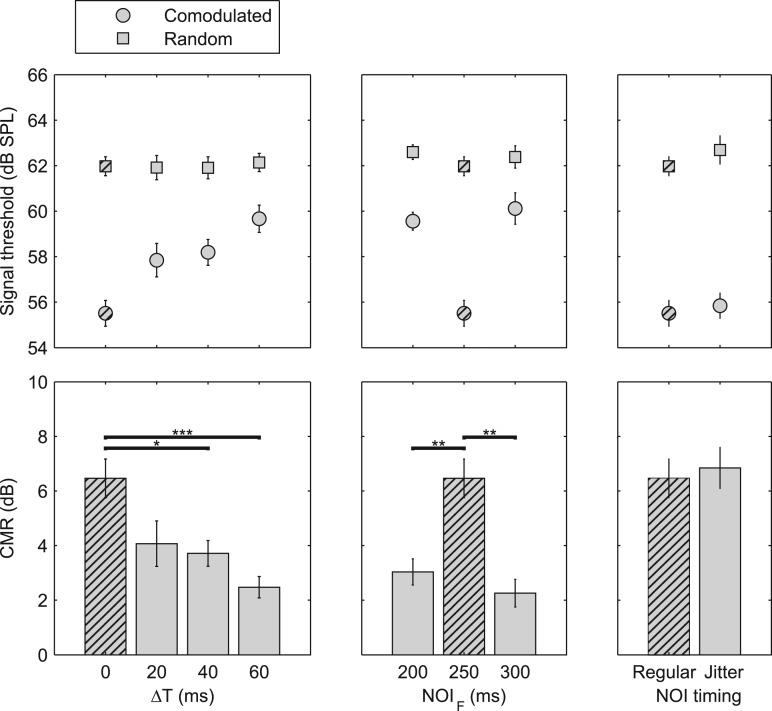
Figure 2.
Mean results from the seven subjects tested in experiment 1. The upper panels show the detection thresholds for the comodulated (circles) and random (squares) ongoing envelopes of the noise bursts. The bars in the lower panels show the amount of CMR, defined as the difference between the thresholds in the comodulated and random ongoing envelope conditions. The error bars represent ±1 standard error of the mean across subjects. The baseline condition (ΔT = 0 ms; NOIM= NOIF = 250 ms, no jitter) is indicated by hatching and is shown in all panels. The asterisks in the lower panels show the results of post hoc (Tukey's test) comparisons of CMR between conditions, where *, **, and *** indicate p < 0.05, p < 0.01, and p < 0.001, respectively. The leftmost panels show conditions with increasing ΔT but identical NOIs. The middle panels show the effect of varying NOIF while keeping NOIM = 250 ms. The rightmost panel show the effect of synchronized, but temporally irregular noise bursts.

