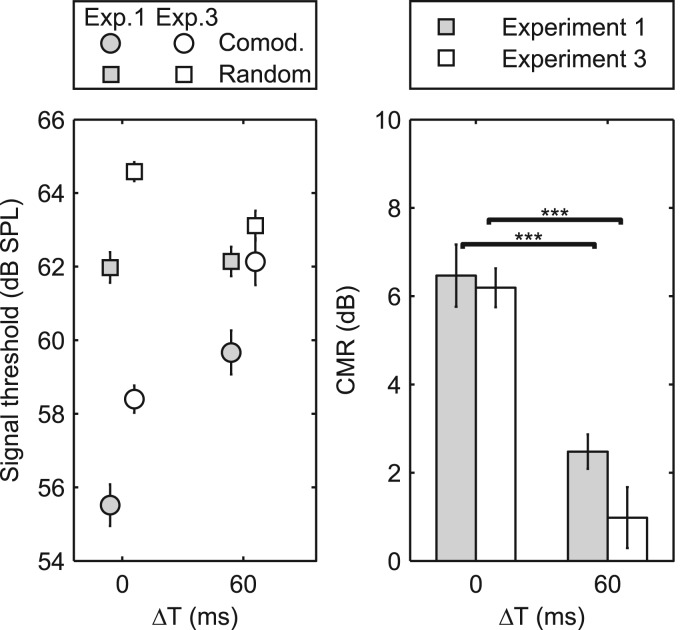
Figure 5.
Results from experiment 3 (open symbols), with data from experiment 1 replotted for comparison (gray symbols) for conditions with ΔT of 0 and 60 ms. The left panel shows the detection thresholds for the comodulated (circles) and random (squares) ongoing envelopes of the noise bursts. The bars in the right panel show the CMR, and the error bars indicate ±1 standard error of the mean between subjects. The asterisks in the right panel show the results of post hoc (Tukey-Kramer) comparisons of CMR, where *** indicates p < 0.001. In experiment 1, the stimuli only contain pre-cursor noise bursts and target interval as depicted in Fig. 1. In experiment 3 the stimuli contain both pre- and post-cursors before and after the target interval, as depicted in Fig. 4.

