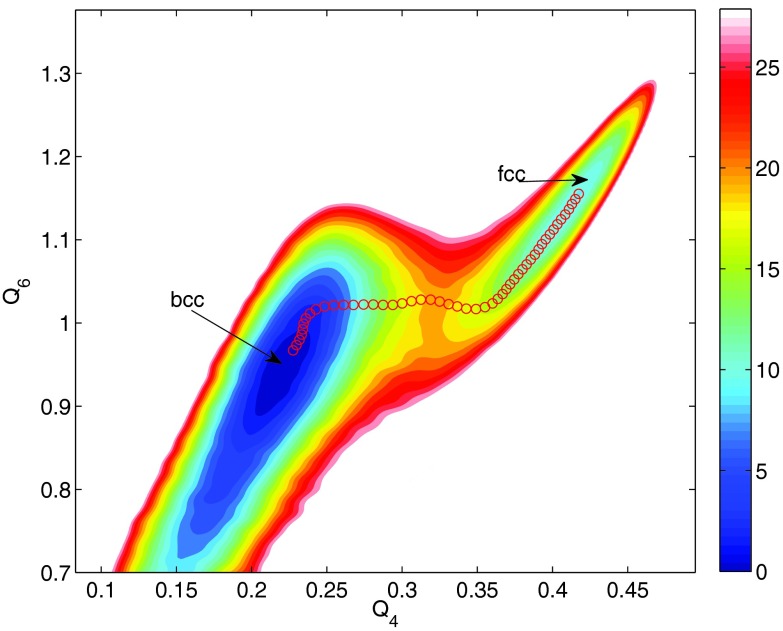
Figure 2.
Free energy surface as a function of Q4 and Q6 when these variables are used as the sole target CVs. The red circles represent the minimum energy path connecting the bcc and fcc basins, as calculated from the string method based on the constructed FES. The free energy values, in eV, correspond to the total free energy of the system.

