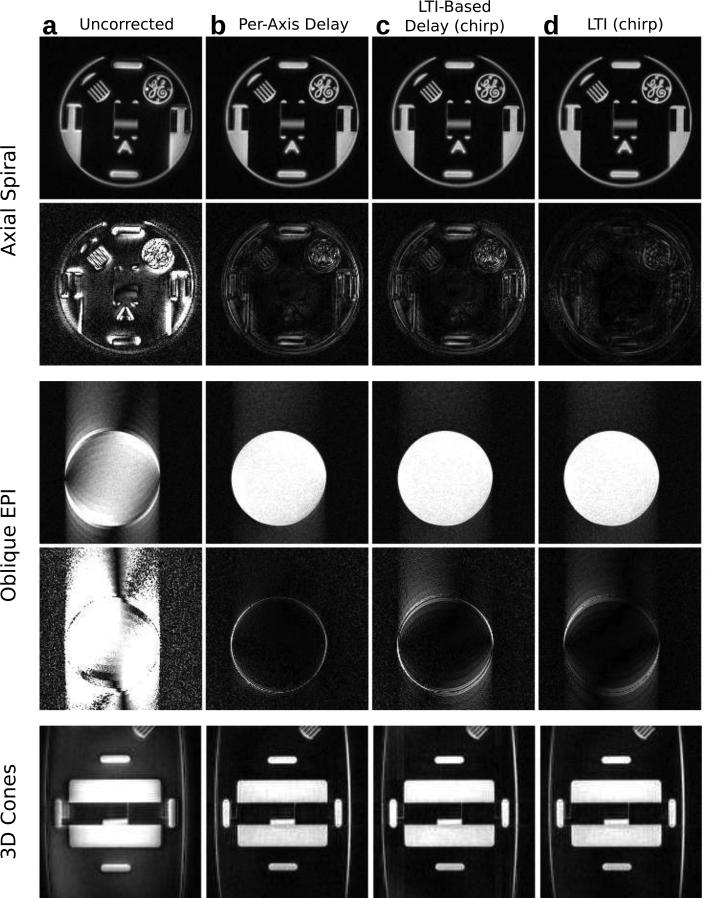
Figure 6.
Axial spiral (top), oblique EPI (middle), and 3D cones phantom images (bottom) reconstructed using the original trajectories (a) and trajectories estimated using the average delay (b), LTI-based delay (c), and full LTI-estimated (d) models. Difference images for spiral and EPI are made from a comparison to a reference image reconstructed based on measured trajectories and are scaled by 8x.

