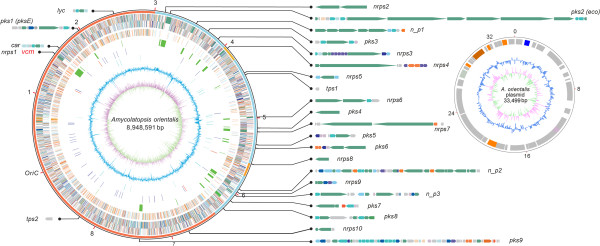
Figure 2.

Genome atlas of the A. orientalis and gene clusters for secondary metabolism. The large circle represents the chromosome: the outer scale is numbered in megabases and indicates the core (red), quasi-core (orange), and non-core (sky blue) regions. The circles are numbered from the outside in. The genes in circles 1 and 2 (forward and reverse strands, respectively) are color-coded according to COG functional categories. Circle 3 shows selected essential genes (cell division, replication, transcription, translation, and amino-acid metabolism; the paralogs of essential genes in the non-core regions are not included). Circle 4 shows the secondary metabolic clusters, which are further enlarged outside the circle for detailed illustration. The vcm cluster is further illustrated in Figure 6. Circle 5 depicts the RNAs (blue, tRNA; red, rRNA). Circle 6 shows the mobile genetic elements (transposase, phage). Circle 7 depicts the GC content. Circle 8 shows the GC bias (pink, values > 0; green, values < 0). The small circle on the right side represents the plasmid DNA sequence. The outer scale is numbered in kilobases. All of the genes, regardless of the forward or reverse strands, are illustrated in the same circle. Circles 2 and 3 are the same as circles 7 and 8 of the large chromosome, respectively.
