Fig. 1.

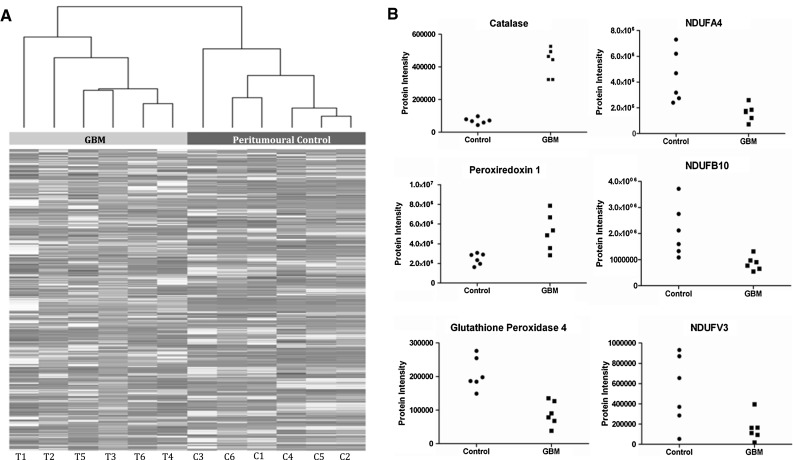
Overview of proteomic data from mitochondrial fractions. Hierarchical clustering of the 902 proteins (normalised protein intensities) detected by LC–MS in mitochondrial fractions of GBM (T) and peritumoural control brain (C). Each column (in greyscale) represents the proteomic profile (intensities of the 902 proteins) in a single sample. Protein intensities were extracted from Progenesis software. The dendrogram (x-axis) provides a visual representation of sample–sample correlations, with correlated samples grouped in branches. Note there are two main branches to this dendrogram which precisely correspond to the two experimental groupings GBM and peritumoural control. The data highlight that there are global differences in the mitochondrial enriched proteome in GBM compared to peritumoural control. Illustrative changes in 3 proteins associated with oxidative damage (catalase, peroxiredoxin 1 and glutathione peroxidase 4) and 3 proteins associated with the Electron Transport Chain (NDUFA4, NDUFB10 and NDUFV3) in GBM relative to peritumoural controls. Each point represents an individual patient
