Figure 4.

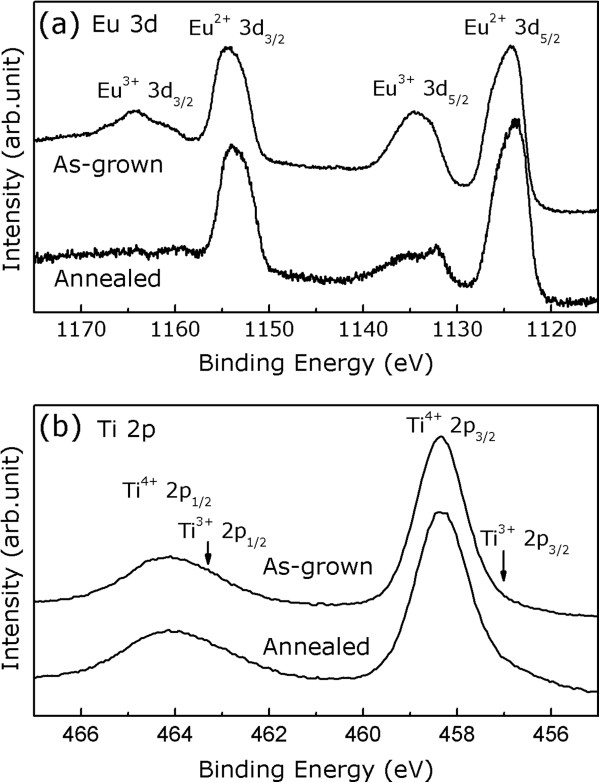
XPS spectra of the as-grown and postannealed samples. (a) A comparison of the Eu 3d core-level XPS spectra between the as-grown and postannealed samples. (b) Ti 2p core-level XPS spectra of the as-grown and postannealed samples.

XPS spectra of the as-grown and postannealed samples. (a) A comparison of the Eu 3d core-level XPS spectra between the as-grown and postannealed samples. (b) Ti 2p core-level XPS spectra of the as-grown and postannealed samples.