Figure 5.

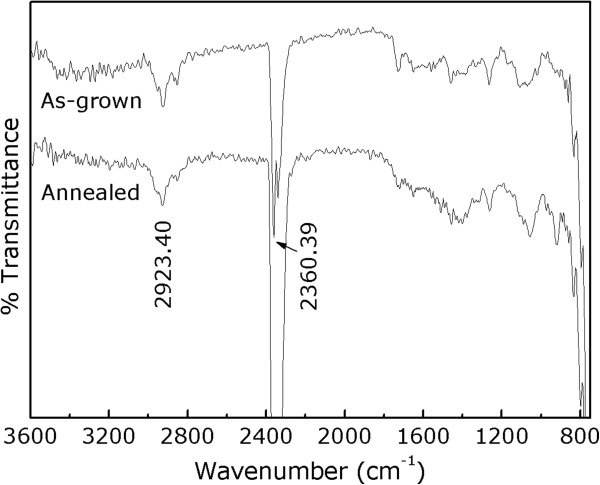
FTIR spectra of the as-grown and postannealed samples. The peak at 2,360.39 cm-1 is due to contributions from CO2 present in air.

FTIR spectra of the as-grown and postannealed samples. The peak at 2,360.39 cm-1 is due to contributions from CO2 present in air.