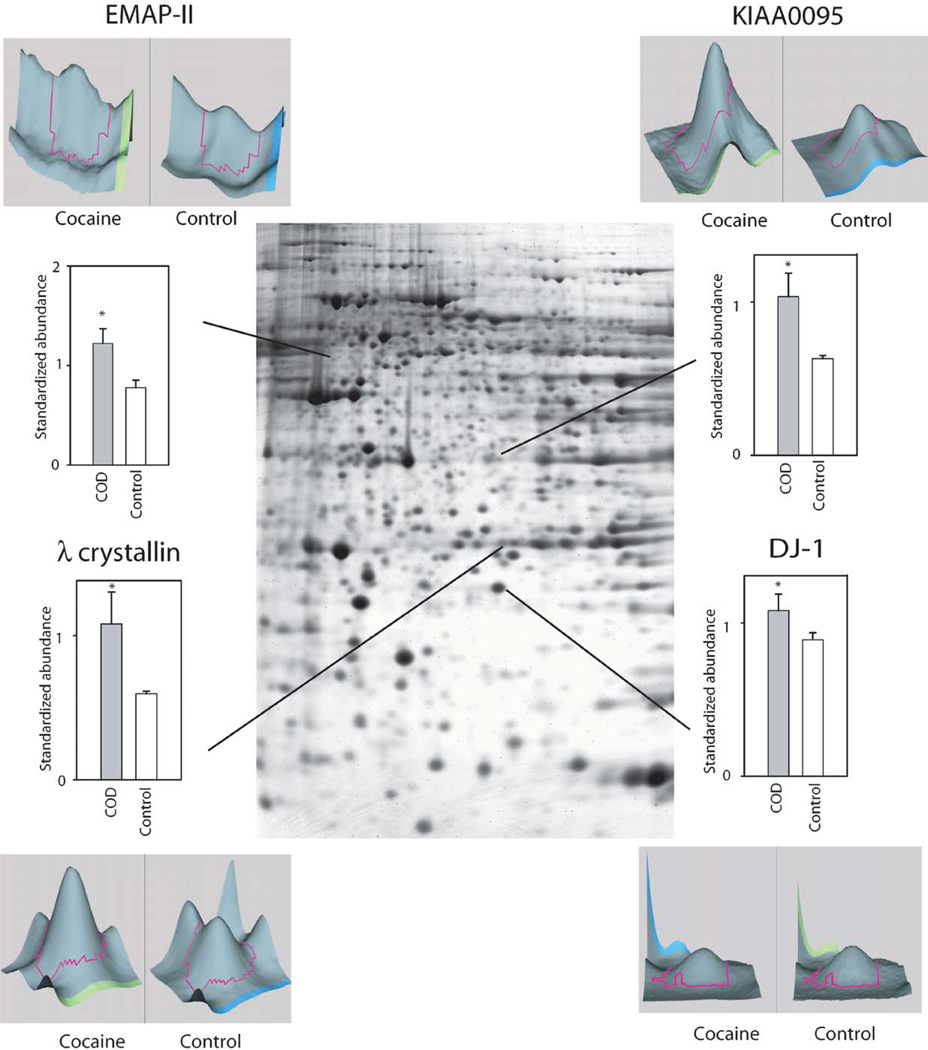
Fig. 1.
Preliminary data of representative proteins exhibiting increased abundance in COD victims. Signal intensities for specific gel spots from COD victims and control subjects were compared. Included in the figure are the proteins quantified by the 2DIGE technique using the normalization by Cy2-labeled pool sample and have statistical significance difference in expression profiles between the two groups (*p<0.05, t-test). Examples of proteins are provided with representative 3-D plots of individual COD and control spots.

