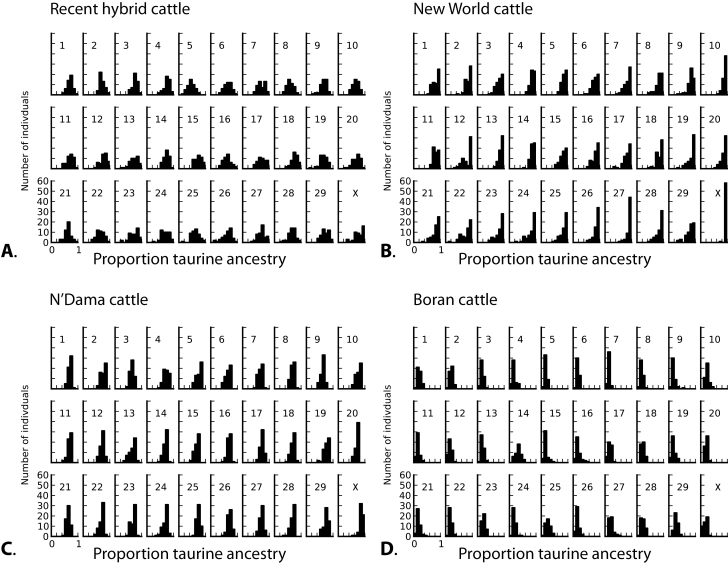
Figure 1.
Histograms showing estimated proportion of taurine ancestry for individuals on each chromosome. The x axis indicates estimated taurine ancestry as calculated using STRUCTURE. The y axes are scaled to percentages of sampled individuals. (A) Recent hybrid cattle (Beefmaster and Santa Gertrudis). (B) New World cattle (Texas Longhorns, Corriente, and Romosinuano). (C) Western African cattle (N’Dama). (D) Eastern African cattle (Boran). Note near-complete absence of admixture on the X chromosome in New World cattle.

