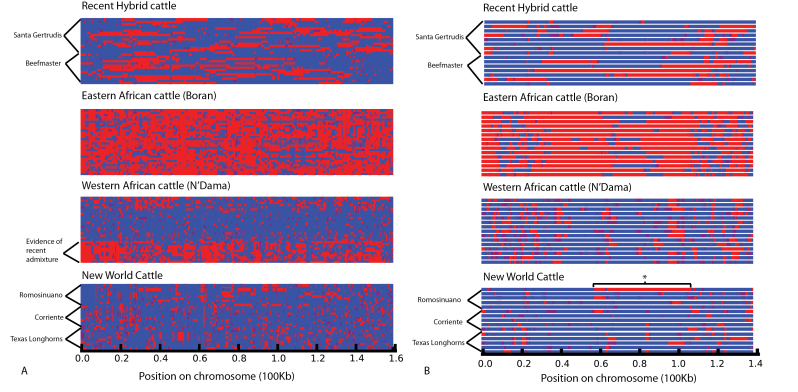
Figure 3.
Admixed ancestry across chromosomes. Ancestry of chromosomal regions estimated by ChromoPainter. (A) Chromosome 1 inferred from 3150 SNP markers (B) X chromosome with pseudoautosomal region excluded, inferred from 872 SNP markers. Each horizontal line represents a haplotype (2 from each individual on chromosome 1; single haplotypes displayed for the X chromosome), and the colors represent estimated ancestry of each chromosomal region (blue indicates greater than 75% probability taurine; red indicates greater than 75% probability indicine; yellow indicates intermediate probabilities). The 2 donor populations (taurine and indicine) were based on individuals that were estimated to have less than 2% of introgressed ancestry. The figure illustrates 15 representative individuals from each of 4 groups of interest (New World cattle, N’Dama, Boran, and recent hybrids). The asterisks (*) mark evidence of recent introgression in a Romosinuano individual.

