
Figure 19.
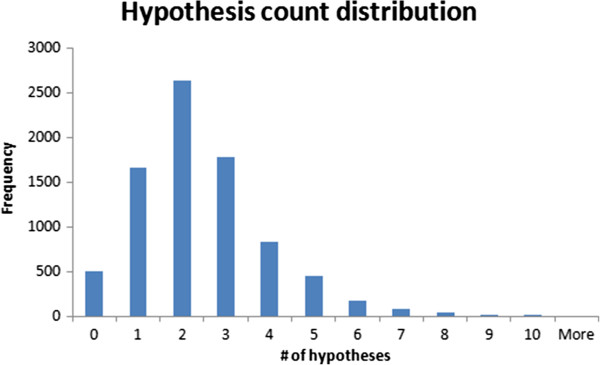
Number of hypotheses used per prediction. The figure presents a distribution of the hypothesis count per prediction during a 5 fold cross-validation experiment using the previous mutagenicity dataset (8201 structures). The most common case is a prediction based on 2 hypotheses and 90% of the predictions were based on 4 or less hypotheses.