
Figure 2.
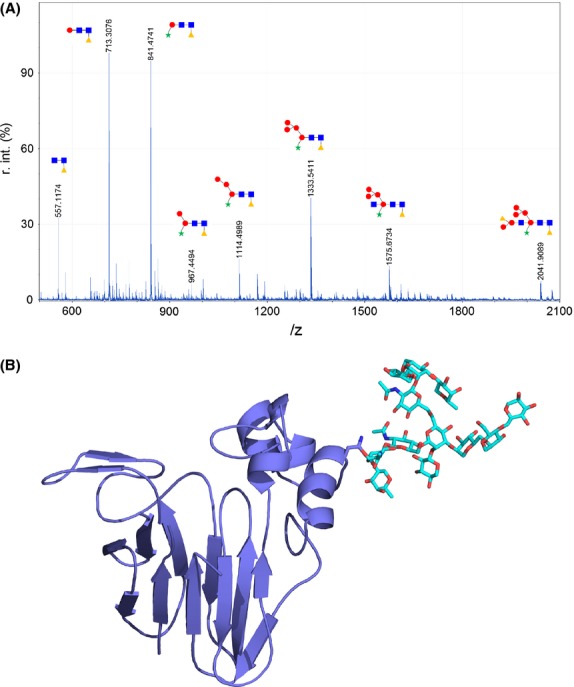
(A) N-glycan structures detected by mass spectrometry. Circles correspond to mannose, squares to N-acetylglucosamine, triangles to fucose, and stars to xylose. (B) Ribbon diagrams of Act d 2 showing the main sugar moiety as stick-like structures.