Figure 7.
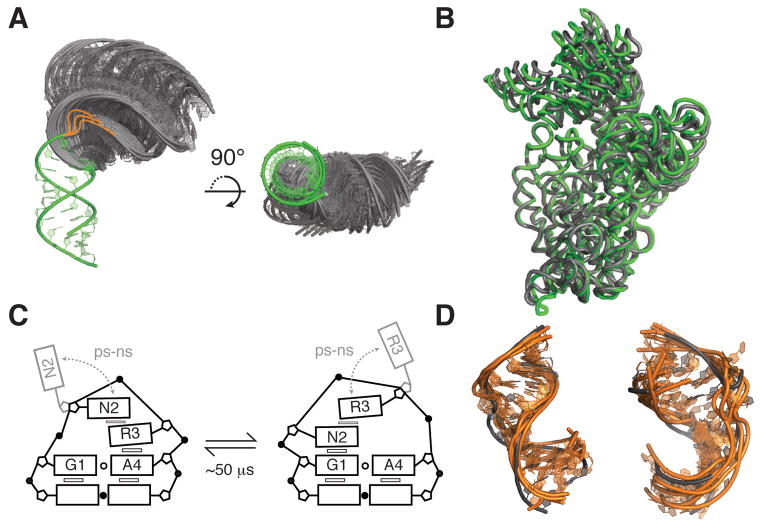
Modes and functions of Tier 2 jittering dynamics. (A) View of 50 most probable inter-helical conformations for a 3-nt two-helix bulge junction with the lower stem superimposed (green). Most probable conformations were obtained from coarse-grained model simulations that include only steric and connectivity forces (178). Bulge residues were included in coarse-grained modeling but not shown in the figure, instead drawn as orange lines highlighting the possible paths of the bulge. (B) Superposition of classical (green; PDB ID 2WDG) and ratcheted EF-G bound 16S rRNA conformations (grey; PDB IDB 4JUW), highlighting the large inter-helical dynamics associated with ribosomal translocation. The rRNAs were superimposed using residues 1410–1430 and 1470–1490 of H44, with H44 facing the page. (C) Dynamics of the GNRA tetraloop observed by fluorescence spectroscopy (159). Exchange timescales correspond to rates measured by base relaxation (55) and sugar carbon NMR relaxation dispersion experiments (158). (D) Superposition of ligand bound HIV-1 TAR structures (grey) with five conformers from a high-resolution NMR-MD ensemble that have the lowest heavy-atom RMSD to the ligand-bound structures (orange) (123). Left, PDB ID 1LVJ. Right, PDB ID 1UTS.

