
Figure 1.
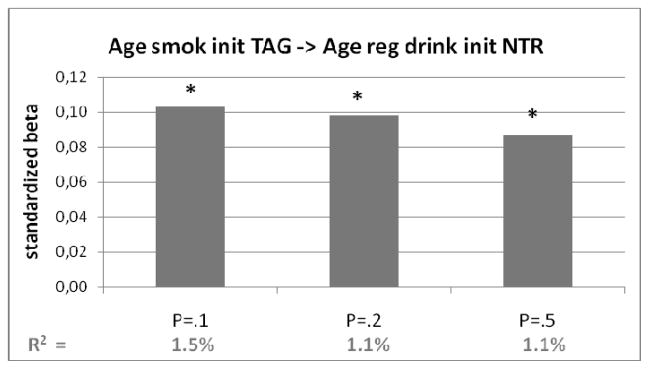
Polygenic risk score of age at smoking initiation (with different p-value thresholds) predicting age at regular drinking in target sample from NTR. On vertical axis the standardized regression coefficients (beta) from the regression analyses. In bottom row the explained variance (R2). Bars marked with a *: p<.05