
Figure 1.
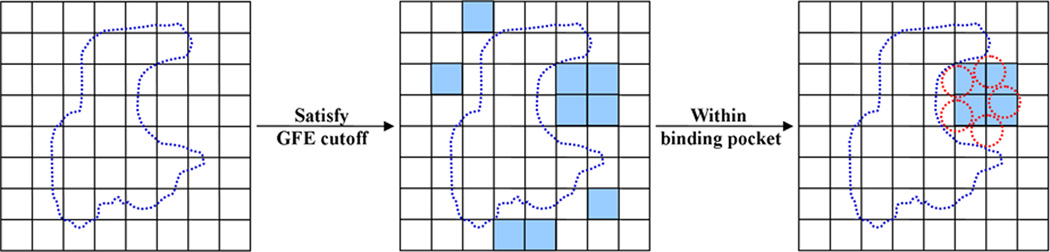
2D diagram of the first key step in pharmacophore model generation. The blue dotted shape represents a protein surface and each square corresponds to one voxel in the FragMaps. Blue colored squares represent voxels that have GFE values lower than the user input cutoff and red dotted circles or the rectangular region indicates the extent of the binding region to be considered for further pharmacophore development.