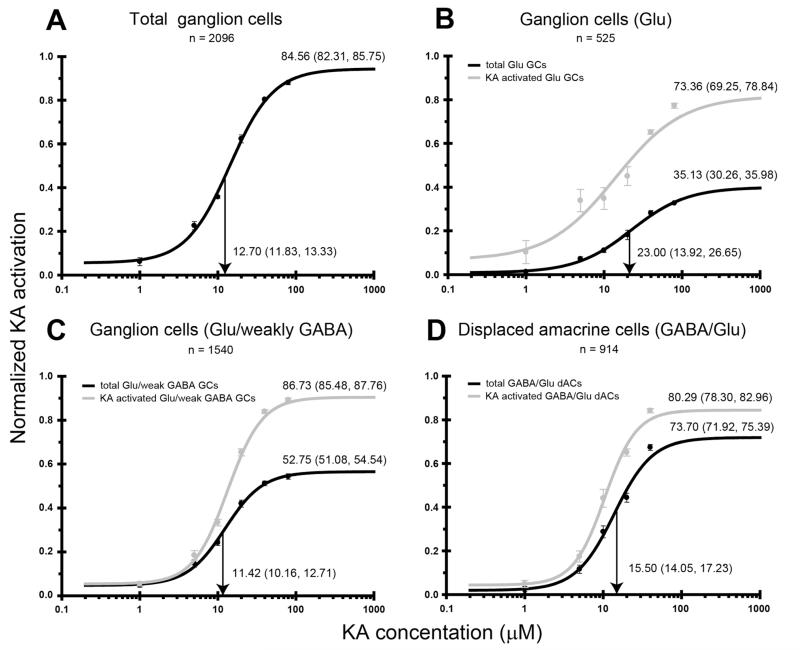
Figure 12.
Kainate (KA) dose-response curves for neurochemically distinct cell populations in the ganglion cell layer. Activation curves are presented for (A) all ganglion cells (GCs) within the ganglion cell layer, (B) glutamate (Glu)-immunoreactive GCs, (C) Glu/weakly γ-aminobutyric acid (GABA)-immunoreactive GCs, and (D) displaced amacrine cells (ACs). The black lines indicate the number of KA-activated cells in the cell population as a percentage of the total number of activated cells present. The gray lines indicate the percentage of cells within a neurochemical class that are activated by KA. Activation curve annotations and axes labeling are as described in Figure 3.

