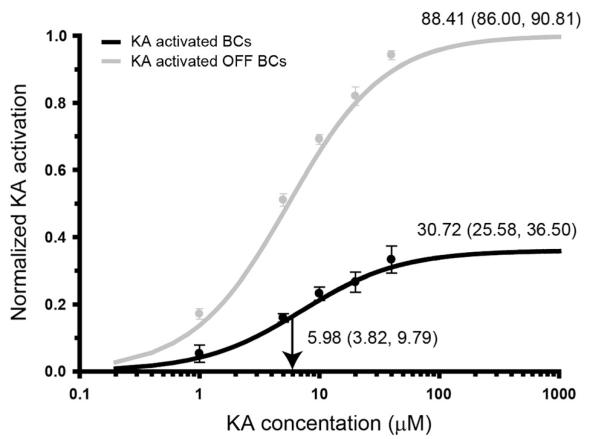
Figure 3.
KA dose–response curves for OFF cone and total bipolar cell (BC) populations. The black line indicates the number of kainate (KA)-activated BCs in the cell population as a percentage of the total number of BCs present (n = 556). The gray line indicates the percentage of OFF BCs activated by KA. KA concentration is presented as a log 10 scale on the x-axis; percentage activation on the y-axis is presented as a normalized response where 1.0 indicates activation of 100% of the population. Annotations at the activation curve plateau indicate the mean total percentage of cells activated at saturating KA concentrations (80 μM KA). Vertical black arrows and their annotations delineate the half-maximal KA concentration. Bracketed values indicate the bounds of the 95% confidence interval. The data points in the dose–response curve have had the proportion of basal AGB-labeled cells subtracted so each datum point reflects true KA activation.

