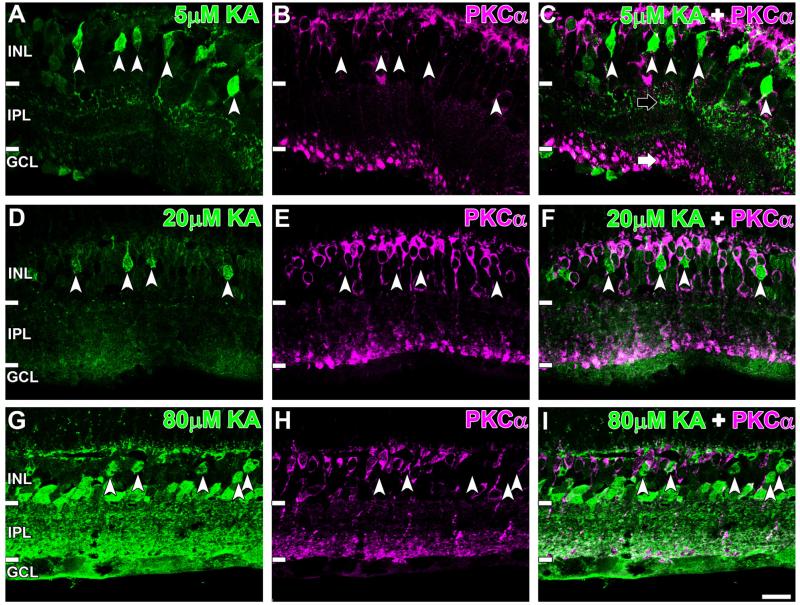
Figure 5.
Immunoreactivity of AGB (green) and the rod bipolar cell (BC) marker protein kinase C-α (PKCα; magenta) secondary to (A–C) 5 μM, (D–F) 20 μM, and (G–I) 80 μM kainate (KA) activation. PKCα did not colocalize with activated BCs (white arrowheads) at all KA concentrations shown. PKCα-immunoreactive axon terminals localized to sublamina b are indicated by the white arrow, and the KA-activated terminals are indicated by the black arrow. Retinal layer annotations are the same as in Figure 2. Scale bar = 20 μm in I (applies to A–I).

