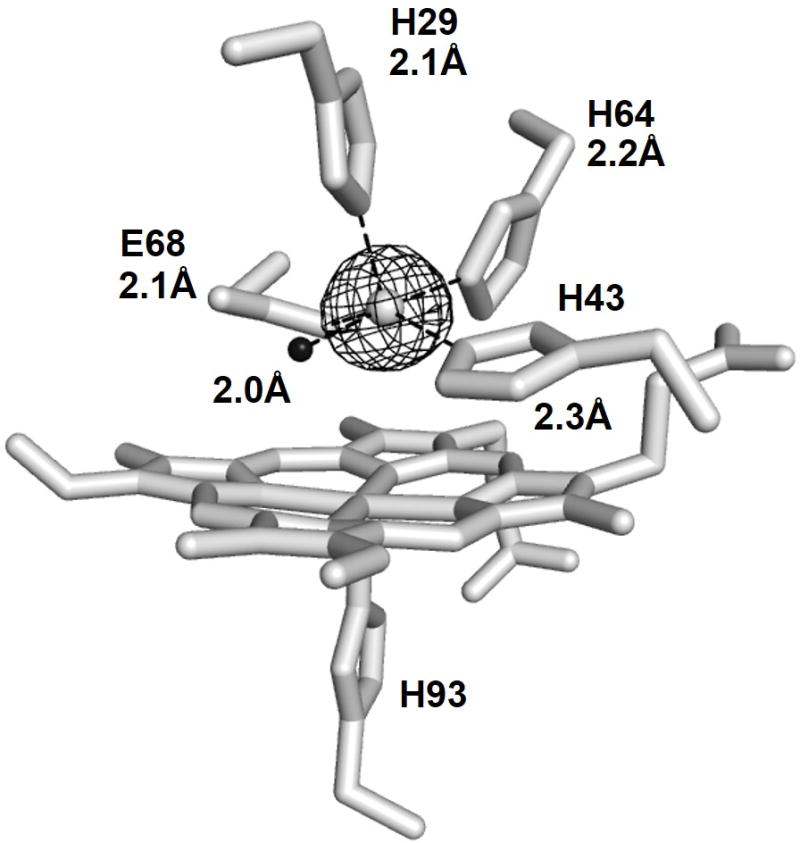
Figure 3.

1.52 Å X-ray structure of Fe(II)-ZnPPFeBMb1. ZnPP, and the coordinating residues are shown as sticks. Fe is shown as gray sphere, the water molecule is shown as black sphere. The anomalous map generated in PHENIX[12] from the data collected at the Fe K-edge at 7.2 keV is drawn at 7σ and shown as gray mesh. Rfac=0.18, Rf=0.22. Figure was generated using PyMol.[9] PDB ID 4MXK.
