
Figure 5.
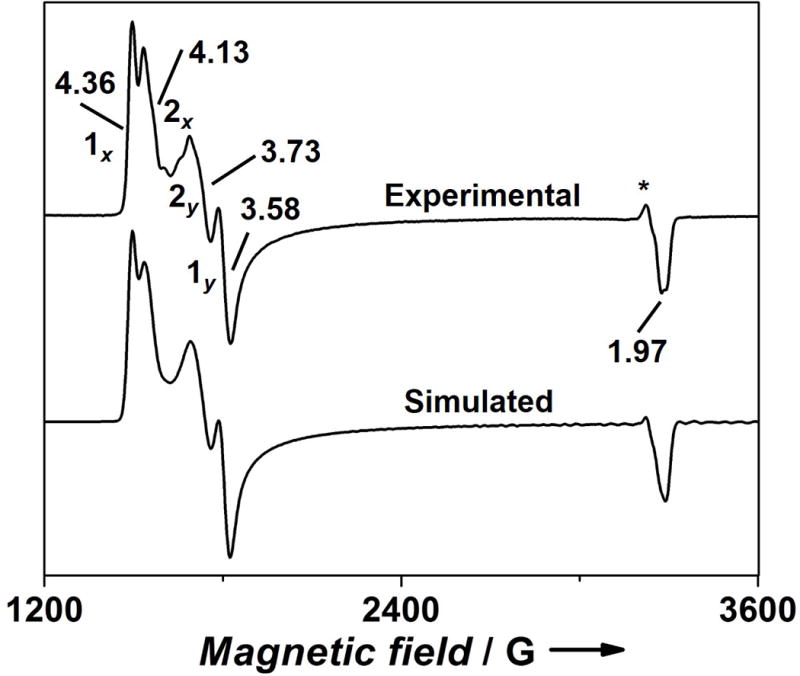
X-band EPR spectrum of a sample containing 0.7 mM ZnPPFeBMb1 in the presence of 1.0 eq. FeCl2 and 20 eq. of NO in 50 mM Bis-Tris buffer pH 7.3, and the simulated spectrum. Excess NO was used to ensure saturation of the FeB site. Experimental parameters: T = 5 K, microwave frequency = 9.053 GHz, microwave power = 20 dB, modulation amplitude = 4 G. g values and the components are labeled. *A radical type peak (<1%).