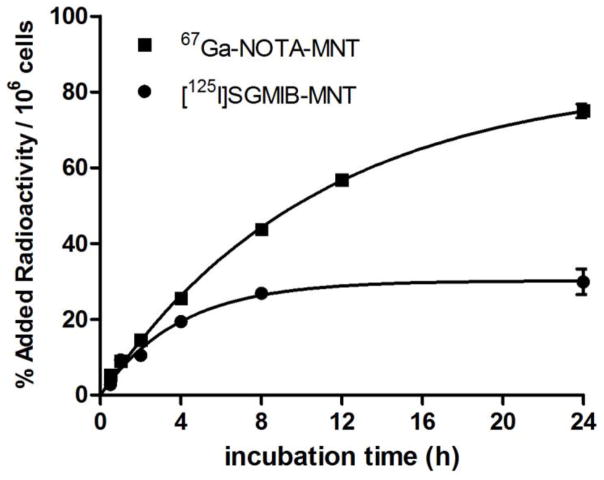
Fig. 7.
Comparison of intracellular localization kinetics of 67Ga-NOTA-MNT to [125I]SGMIB-MNT [14] in A431 cells expressed as percent of added radioactivity per 106 cells. Error bars represent the standard deviation of triplicates for each time point.

