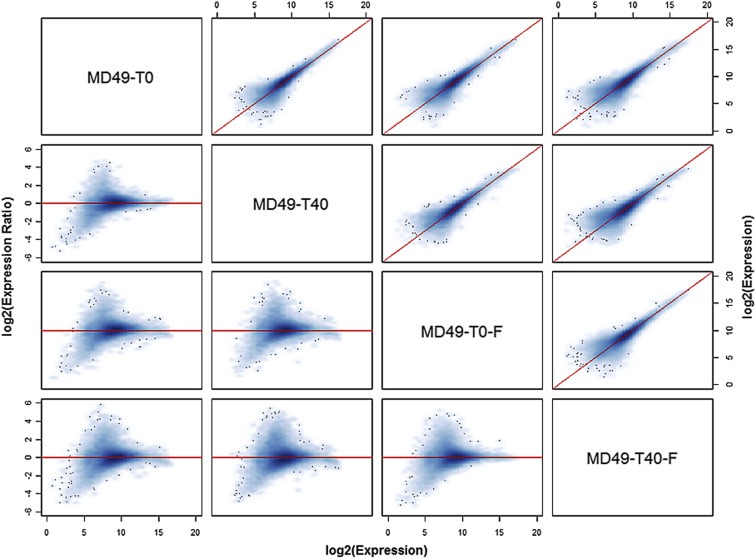
Figure 1.

Concordance matrix of global gene expression measurements obtained from specimens derived from the same tumor. Specimens from tumor MD49 were preserved in RNAlater immediately after mincing (T0) or after a 40 min delay at room temperature (T40), or were snap frozen immediately (T0‐F) or after a 40 min delay at room temperature (T40‐F). The concordance plots above the diagonal compare the expression levels of all transcripts in each pair of specimens, with the diagonal line indicating perfect concordance. The corresponding log ratio vs. average (MA) plot for each pair of specimens is shown below the diagonal, where for each transcript the difference in log2 expression values is plotted against their mean. Here, the horizontal line through zero indicates perfect concordance; points above the horizontal line represent transcripts expressed higher in the left‐most sample, whereas points below the line are expressed higher in the second sample (e.g. the M‐A plot in the second row, first column shows expression in T0 vs. T40; points above the zero line are transcripts expressed higher in T0 and those below are transcripts expressed higher in T40).
