
Figure 4.
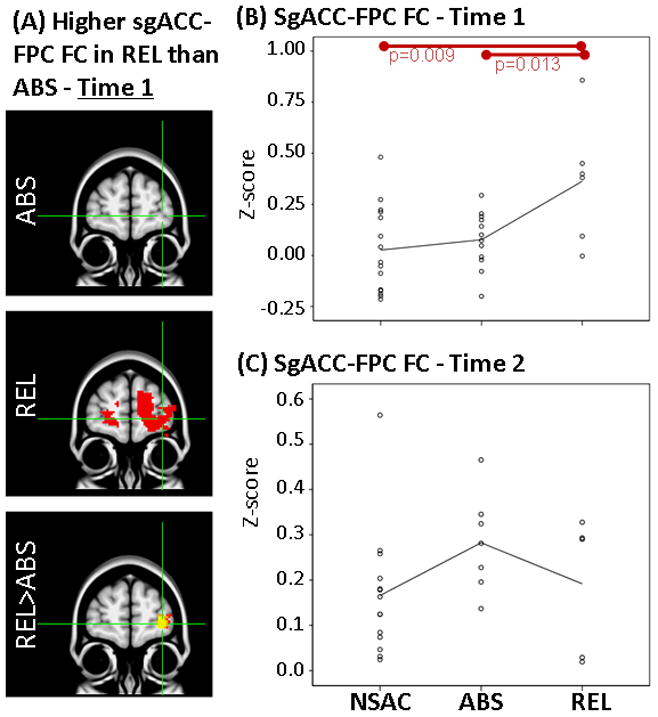
Results showing higher FC between sgACC and FPC at Time 1 but not at Time 2 in REL when compared to ABS. LEFT: (A) Whole-brain FC maps showing regions with significant connectivity to sgACC (p<0.025, corrected for multiple comparisons) in ABS (1st row) and REL (2nd row). Bottom row shows whole-brain independent samples t-test results in which REL had significantly higher sgACC-FPC than ABS (p<0.025, corrected for multiple comparisons). Functional maps are laid on MNI brains in radiological orientation (right is left). RIGHT: Scatter plots showing z-scores representing strength of sgACC-FPC FC in the NSAC, ABS and REL groups at Time 1 (B) and Time 2 (C). Each dot represents an individual subject’s average z-score within the FPC cluster. Red bars show significant difference between groups. FC, functional connectivity; sgACC, subgenual anterior cingulate; FPC, frontopolar cortex; REL, stimulant addicts that relapsed over six months; ABS, stimulant addicts that remained abstinent over six months; MNI, Montreal Neurological Institute; NSAC, non-substance abusing controls.