
Figure 5.
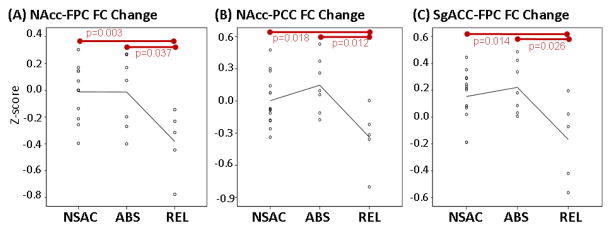
Scatter plots showing change in FC between (A) NAcc and FPC, (B) NAcc and PCC and (C) sgACC and FPC. Each dot represents FC change in an individual subject (Time 2 z-score minus Time 1 z-scores). Red bars show significant difference between groups. NAcc, nucleus accumbens; FPC, frontopolar cortex; PCC, posterior cingulate cortex; sgACC, subgenual anterior cingulate; REL, stimulant addicts that relapsed over six months; ABS, stimulant addicts that remained abstinent over six months; FC, functional connectivity.