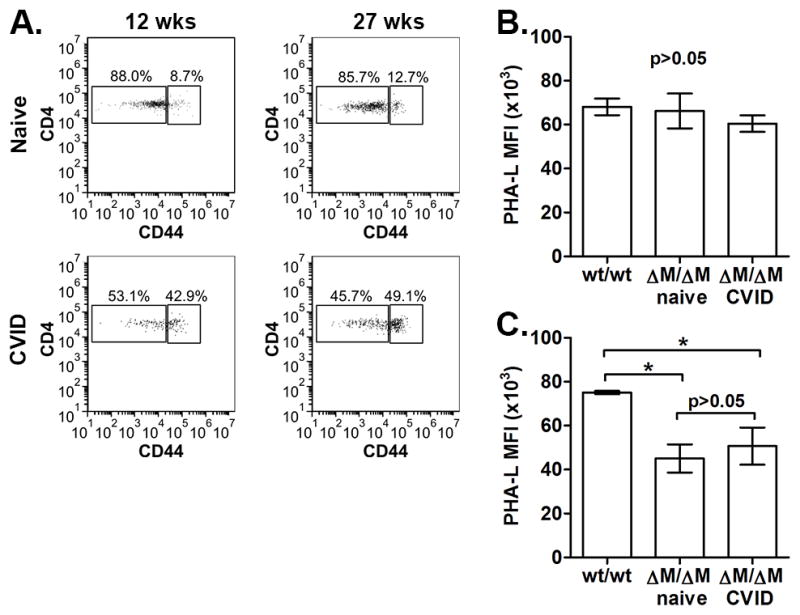
Figure 2. The abnormal T cell distribution in CVID-Mgat2ΔM/ΔM mice is maintained with age and independent of changes in T cell surface glycosylation.

A) Representative analysis of blood CD4+ T cell phenotype from the same naïve Mgat2ΔM/ΔM or CVID-Mgat2ΔM/ΔM mouse at 12 and 27 weeks of age. Comparison between B) T cell (CD3+) and C) neutrophil (Gr1+CD11b+) cell glycosylation profiles from Mgat2wt/wt, naïve Mgat2ΔM/ΔM, and CVID-Mgat2ΔM/ΔM mice using flow cytometry and fluorescently labeled PHA-L lectin. *p<0.05
