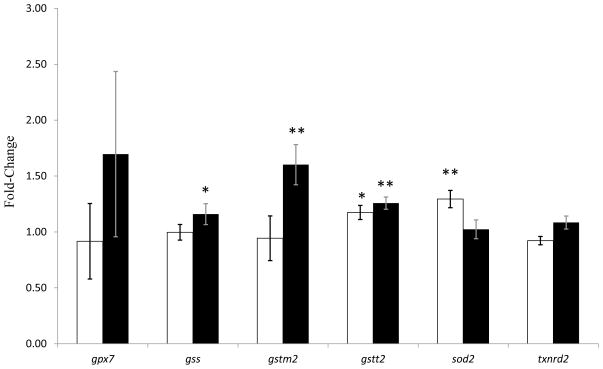
Fig 5.
Expression of oxidative stress genes in paraoxon-treated HSG cells. Cells were treated with either ethanol (0.1%) as a control or 10 μM PX for 4h (white bars) or 24 h (black bars). Fold-change measured by q-RT-PCR of gpx7, gss, gstm2, gstt2, sod2, and txnrd2 was measured. Expression was normalized to gapdh expression. Once data had been normalized (ΔCT), the average of 4 replicates in each group was used to calculate the ΔΔCt and fold change (fold-change = 2(ΔΔCT)). p-Values were calculated using ΔΔCt values, n=4, compared to the control using Student’s t-test. * represents p values < 0.05, ** represents p values < 0.01.

