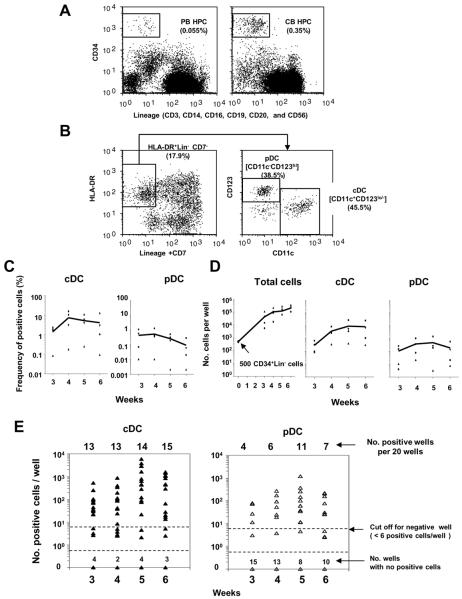
Figure 1. Growth and differentiation kinetics of DC-lineage progenies generated from PB HPCs.
(A) Representative flow cytograms of CD34+Lin− cells (HPCs) in PB (left panel) and CB (right panel) mononuclear cells.
(B) Representative flow cytograms of HLA-DR+Lin−CD11c+ CD123lo-cDC lineage and HLA-DR+Lin−CD11c− CD123hi - pDC -lineage progenies generated from PB CD34+Lin− cells in 5-week OP9-DL1 co-culture in the presence of KL, IL-7, and FL.
(C and D) Time courses of cDC- and pDC-lineage differentiation from PB CD34+Lin− cells. PB CD34+Lin− cells from four donors were cultured at a concentration of 500 cells per well in a 24-well plate where OP9-DL1 stroma cells had been pre-seeded in the presence of KL, IL-7, and FL. Percentage (C) and absolute number (D) of cDC- and pDC-lineage progenies generated from CD34+Lin− cells are plotted against time (weeks). Solid lines connect the average values.
(E) Time course of cDC- and pDC-lineage differentiation from CD34+Lin− cells of one donor. Each dot represents the total number of cDC (left panel) or pDC (right panel) generated from twenty CD34+Lin− cells in a well of 384-well plate. Twenty wells were analyzed for each of 3, 4, 5, and 6 weeks. A well exhibiting 6 or greater positive events was designated a positive well for LDA. Similar results were obtained from two experiments for two other donors.

