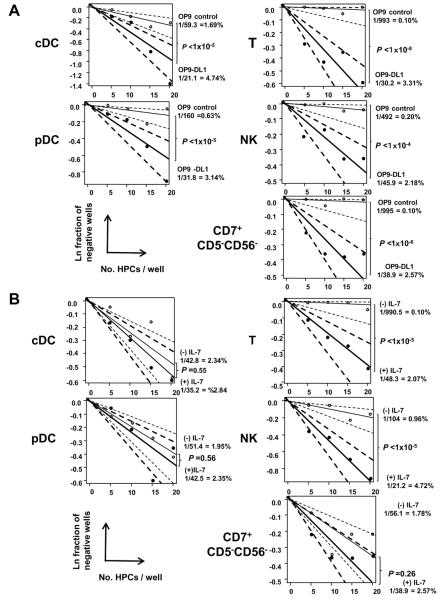
Figure 2. LDA for determination of cDC, pDC, T-, and NK-cell PFs in PB HPCs in the presence or absence of Notch 1 signaling and IL-7.
LDA for determination of cDC,pDC, CD7+CD5+ T-, CD7+56+ NK-, and CD7+CD5−CD56− cell PFs in HPCs by co-culture with OP9-DL1 cells (closed circle and thick line) or OP9 control cells (open circle and thin line) (A) and with OP9-DL1 cells in the presence (closed circle and thick line) and absence (open circle and thin line) of IL-7 (B). One thousand PB CD34+Lin− cells from one donor were sorted into wells of 384-well plates at frequency of 20, 15, 10, or 5 cells per well (20 wells for each cell frequency) and co-cultured with OP9-DL1 or OP9 control cells for five weeks. Natural logs of negative-well fractions were plotted against the number of CD34+Lin− cells plated per well for cDC and pDC (left panel), and T-, NK-, and CD7+CD5−CD56−-cell (right panel) precursors using ELDA software. Dotted lines represent 95% confidence intervals. P-values of the differences of PFs between co-culture with OP9-DL1 and OP9 controls, and between presence and absence of IL-7, are shown in each LDA plot. The PFs were converted to the percentage in CD34+Lin− cells. Similar results were obtained from three experiments for three other donors.

