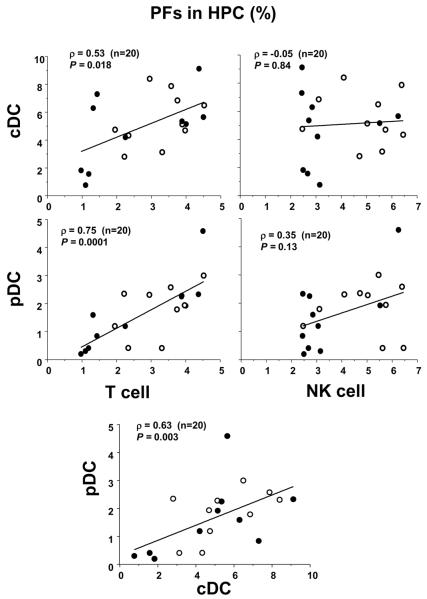
Figure 4. Correlation of PF between DC and T- or NK-cell lineages in PB HPCs from healthy donors.
Correlation of PF between cDC and T- or NK-cell lineages (upper panel) and between pDC and T- or NK-cell lineages (lower panel) in PB from 20 donors (10 females: open circles, 10 males: closed circles, age range: 28 to 64). Spearman's rank correlation coefficients (ρ) are shown in each panel with P-values.

